
Storm-powered* local AI
· 3 min read
I wrote before about the energy use of our local AI pipeline. This is an update, after running the machine over a much larger batch of material, and speaking to some other organisations about the monitoring feature.
Our internal documentation site now shows where the electricity in the south of Scotland is coming from, not just how much power the machine itself is drawing. Over the past week it has, unsurprisingly, been almost all wind:
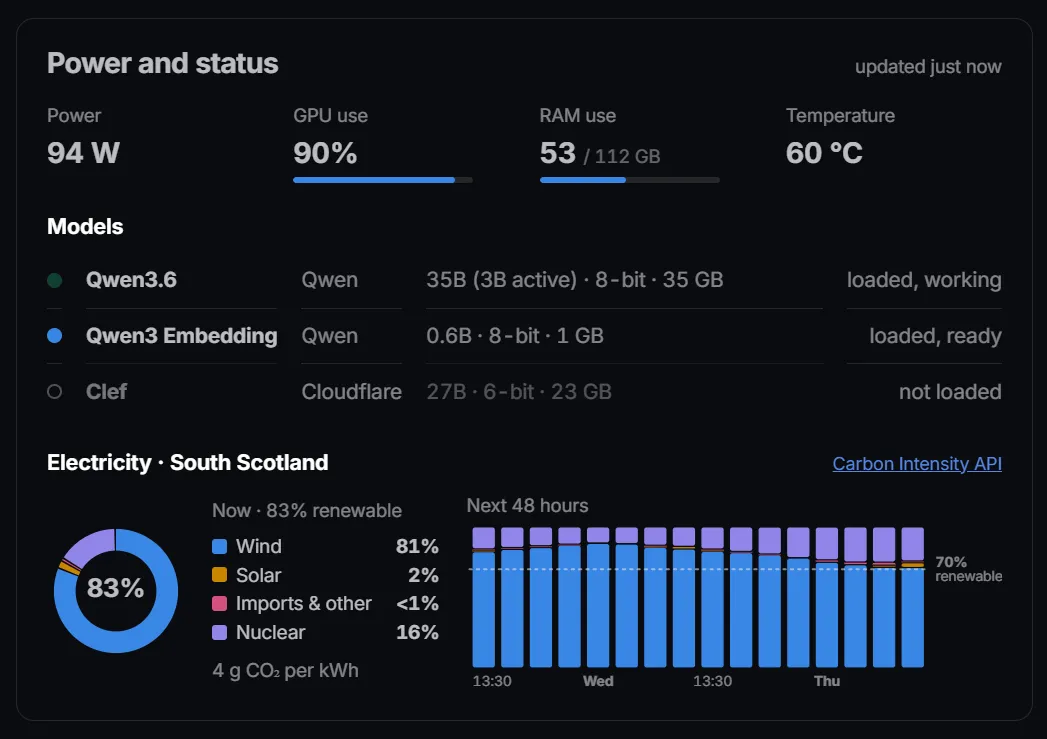
The pipeline has a pause setting: if the grid drops below 70% renewable, it finishes the record it's working on and waits until the grid is clean again. That used to be a manual step. But when I've talked to other libraries and organisations about using what we’ve developed, the part people pick up on is being able to report on the energy use of running AI locally. So I've made the monitoring a deliberate part of the pipeline, and streamlined the config and paratext cli flag implementation.
Development changes
- A project says where the machine is (
region = "south-scotland") and whether to wait for a clean grid (this is set in config or with an env). paratext carbonshows the grid right now, whether runs would pause in the next 48 hours, and writes the reports. Previously this was a bit of a mess of a few different commands, with separate arguments forcarbonandgreenreporting - it doesn’t make sense any more to keep them separate.- Every half hour, a run records the energy the machine actually used, from its own power sensor, and the grid's fuel mix for that half hour from the NESO Carbon Intensity API.
- A report is generated at the end of each run, as a word doc and a PDF. This includes energy, emissions, number of records, energy per record, renewable share, where the electricity came from, and energy use over the run.
- There’s also an overall report for every project, adding up its runs month by month, plus a spreadsheet of all runs.
- If it’s running on a remote endpoint or hosted AI service, there’s no attempt to record, and the reports aren’t produced. It would be almost impossible to estimate with any degree of accuracy.
- A ‘pause’ gives up after 12 hours and carries on, so a batch can't stall for days.
The code is open source, as part of paratext.
Fourteen thousand books
Here's the report from running the local model over 14,037 born-digital monographs. Working with metadata colleagues, we've tuned it to produce certain metadata at an average of 88% accuracy.
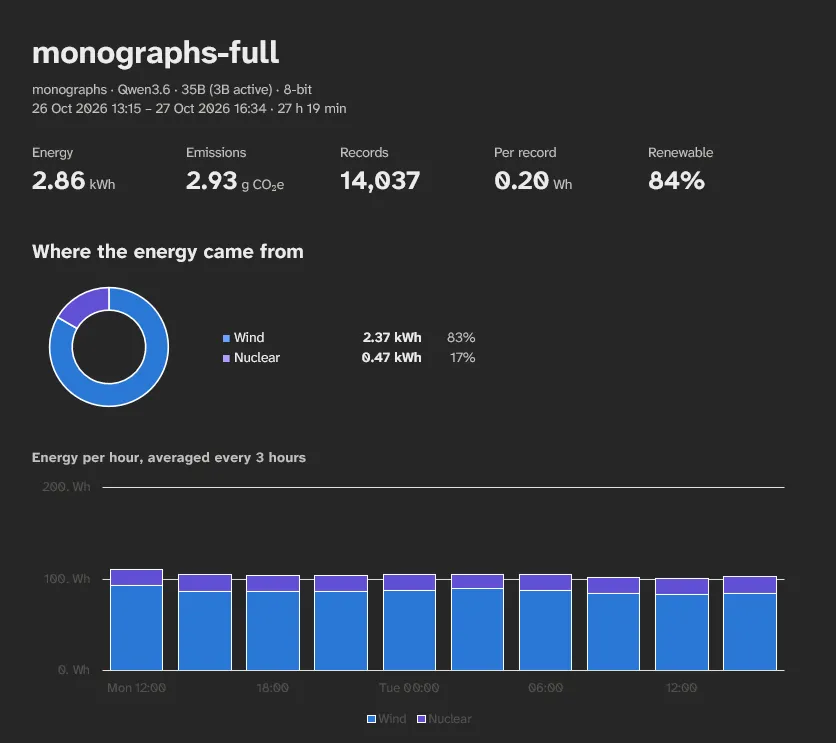
The run took about 27 hours. Thanks to the still-quite-windy post-storm weather, the grid was 84% renewable the whole time, and the run never needed to pause.
2.93g of CO₂ emissions were produced. Using rough estimates:
- that’s less than would be produced for boiling one cup of water;
- the same energy on the average UK grid would have produced about 400 g of CO₂, the same as 25 to 30 full kettles;
- on a still day, it would be about 700 g, or about 50 kettles.
In practice, on a still day elsewhere in the grid, Paratext would have paused and waited for the wind to pick up. (This threshold is of course configurable).
* So it's not technically storm-powered, but it's pretty close.